STEP 11. DISASTER RISK ASSESSMENT
11.1 P3DM for disaster risk assessment
Vulnerability and capacity are abstract concepts even when disasters have previously occurred in the area. To make vulnerability and capacity tangible, it is essential to relate them to the potential threat of natural hazards. For instance, dangerous areas with a large number of houses made of wood and palm, and with many children, pregnant women, elderly, and people with a disability or permanent illness can be readily considered at high risk. On the other hand, areas with lower hazards, less vulnerable people and more local resources may be considered at low risk. The 3D map clearly portrays vulnerabilities, capacities and hazards represented by pushpins, yarns and pins.
Therefore, one of the purposes of P3DM for DRR is to make these issues tangible and to lay the foundations for assessing disaster risk. After plotting the map features, a disaster risk assessment can easily and quickly be conducted by the participants themselves.
This assessment of disaster risk therefore reflects the perspective of the local community supported by outside stakeholders, not that of the sole scientists or government officials based upon data extracted from locals. In that sense, it does not require any sophisticated equations, formula or computations.
11.2 Steps in conducting disaster risk assessment through P3DM
The disaster risk assessment table also provides quantitative data. P3DM thus generates what Chambers (2007) has called ‘participatory numbers’ or numbers created through participatory methods and approaches, not just through survey questionnaires or other statistical methods driven by outsiders and external interests. Participatory numbers are often essential to make local knowledge, skills and resources tangible to outside stakeholders who often request for quantitative data to make policy decision. Assessing disaster risk through P3DM is one way of generating such numbers through the counting of pushpins and other symbols on the 3D map by both the members of local communities as well as scientists and local government officials.
Consider the following steps in conducting disaster risk assessment using the 3D map:
- Using large pieces of paper, prepare a blank disaster risk assessment table (Table 12) and hang it on the wall. The table should be context specific.
- Divide the participants into groups, preferably according to the area / village where they live;
- Divide each group again into two sub-groups: one assigned to the3D map and the other to the disaster risk assessment table.
- Ask the participants to list the different areas / villages on the leftmost column of the table.
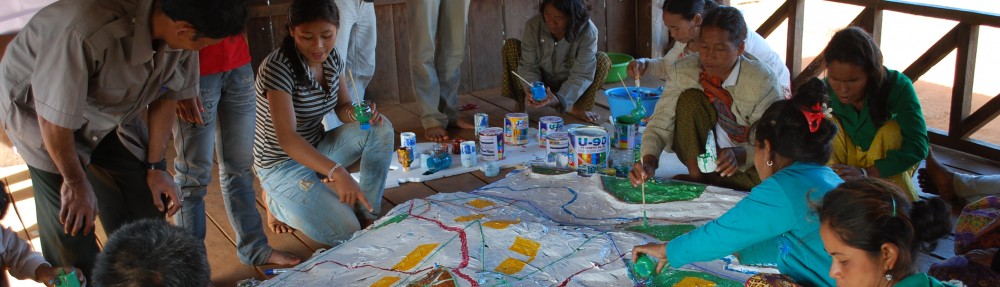
- The different groups complete the table by identifying the hazards threatening their area / village and counting the pushpins and other symbols of the legend (e.g. vulnerable houses, vulnerable people, vehicles) which are within each hazard-prone areas (Figure 51).
- Identify the issues and problems faced by the local community based on the hazards, vulnerabilities and capacities;
- Elaborate the reasons / root causes of these issues and problems;
- They eventually assign a certain level of risk to their villageaccording to the hazard, vulnerabilities and capacities.
Both the map and table provide a tangible basis for assessing disaster risk. It makes it quick and easy to assess, for example, how many people are vulnerable in each area of the village to particular hazards and what the resources in facing such hazards are. In other words, the disaster risk assessment table provides the participants with an overview summary of the risks being faced by the community (Figure 52).

Figure 51: Assessment of disaster risk based on a 3D map built in La Carlota, Philippines (JC Gaillard, January 2011)

Figure 52: Disaster risk assessment table compiling data extracted from a 3D map built in Josefina, Philippines (JC Gaillard, January 2010)
11.3 Combining P3DM with other tools
Obviously, P3DM must be combined with other methods and tools for appraising issues which are not covered in the 3D map but which are yet very important, e.g. client-patron relationships, gender-related inequalities, social networks, and temporal variations in vulnerabilities and capacities. P3DM must therefore be associated with calendars, ranking and scoring, problem trees, Venn diagrams, and other tools of vulnerability and capacity analysis (VCA). See for example von Kotze and Holloway (1996), Abarquez and Murshed (2004), International Federation of Red Cross and Red Crescent Societies (2008) and CARE (2009).

Table 12– An example of disaster risk assessment table

You must be logged in to post a comment.